There have been heated debates, for decades, about the merits of “traditional” Hot Hide Glue used in musical instrument construction (which from now on will be referred to as HHG). Traditionalists insist that the use of HHG is one of the key components that gave many of the pre-war instruments that hallowed vintage tone. Some builders and even manufacturers swear that using HHG improves the tone of their instruments but how do you prove such a claim? The difficulty, with such opinionated debates, lies in scientifically proving that there is indeed a difference and better yet a reason why one adhesive might actually improve the tone of an instrument.
HHG is manufactured from animal hides. The manufacture and use of HHG dates back thousands of years. Furniture and musical instruments have been found inside of Egyptian pharaoh tombs and the glue joints were still in tact. It was the “traditional” glue of choice used in musical instrument construction up until the early 1960’s by many large musical instrument manufacturers.
When I began building guitars in the early 1990’s I used Titebond Original wood glue. Why? Dick Boak said to in one of his books written about guitar construction and assembly. Since Martin and many other major OEM’s used Titebond it must be the best product to use or so I thought. Then as the internet came to age I stumbled upon many discussions about using HHG. Since I have always been driven to build each guitar better than the last one, this topic interested an Engineering geek like me so I decided I would give HHG a try.
I discovered early on there was a learning curve to using this adhesive that our fore-luthier-fathers had such a fondness for. Some of the first problems that I encountered were learning the little idiosyncrasies involved in weighing, mixing, cooking, storing and maintaining an even 145*F ready temperature while using HHG. The glue does not behave the same as most modern glue does. Modern glues have a much longer “open time” which is the amount of time you have to position the parts and clamp them into place before the glue begins to set up. HHG has a 30 second, or less, open time and if the joint isn’t clamped within that amount of time the glue turns into gelatin and immediately looses most of its holding strength.
Clean up can also be a challenge when working with HHG. The squeeze out, of excess glue, begins to gel within seconds and trying to wipe away HHG squeeze out is akin to trying to remove some very, very, very sticky Jello. If you get a blob of gelled HHG on your finger it doesn’t want to leave. It quickly becomes your new best friend. It isn’t painfully attached to your skin or body parts like Super Glue but it is attached like a nuisance pest and transfers to other fingers like it has magical magnetic properties. Pick a blob off of your right hand, with your left hand and then it sticks to your left hand just like it did when it clung to your right hand and vice versa. Try to flick it off the end of your finger and it just stays there. Remember it has become your new bestest buddy 😉
Wood joints must be extremely accurate when using HHG. It will simply not fill any gaps like some of the other modern adhesives will. Well, actually it will fill gaps but the joint strength is tremendously compromised. HHG is an extremely strong adhesive if the joints are tightly fitted but if you get sloppy with your joinery then you might as well use duct tape instead.
I have done some other testing throughout my career and one fact keeps haunting me is that wood has an infinite amount of inherent variation within every single piece of it. Re-saw 10 tops from the same billet of spruce and EACH top will be uniquely different from the top it was sawn next to. This makes running meaningful tests, using wood, very tricky because the results can be confusing. You don’t know if there was a mean shift in the data response or if you are actually seeing the data shift due to variation within the wood itself.
How was I going to test the effects of glue and scientifically prove that one particular glue may be better or worse than other similar glues? There has been testing done in the past on glues which focused on various characteristics like: holding power, shear strength, glue degradation in heat, the degradation of various adhesives under water and I have personally done some extensive hardness testing but more on that later. If glue is going to have any affect on a finished guitar’s Q (quality) of tone then it should be able to allow vibration and sound waves to pass through it efficiently without dampening or impeding the transmission of sound energy. Since the guitar is constructed of many individual pieces of wood, each joint should fit tightly and accurately to its mating adjacent surface and thus not inhibit the transference of vibration energy induced by the strings. In a perfect world we would like to have a mechanical [glueless] wood to wood joint but we know how long that guitar would last before it fell over 😉
Since the glue used in each joint should allow vibrations to pass through the joint then it seems plausible to test the dampening effects of glue by using hi tech vibration analysis hardware. I just happen to know a man that works in a Fortune 100 manufacturing facility that has been doing vibration analysis for the last couple of decades. After I ran my ideas past him he thought it would be fun to help me with this project.
One hurdle we had to overcome in our design of experiment was to eliminate and or reduce the variation which is present in wood so we chose to substitute steel samples in place of wood. Steel certainly has variation in it too BUT it is far more consistent than wood is and since we only wanted to understand the effects of vibration passing through a glued joint it made more sense to reduce as much variation as possible from the experiment to be able to learn the most we could about the glue itself. Therefore, we cut 1” wide x 7” long x .100” thick pieces of steel from the same sheet of steel. Each piece was weighed and the weight was consistent with a range of +- ½ gram.
Accurate and identical registration marks were scribed on each piece of steel. One mark would be used to align a 2” half lap glue joint in the center of the test coupon. Another mark was scribed to register where to clamp one end in a vise and the third mark to locate the impact zone in which to strike the test coupon with an impact hammer.
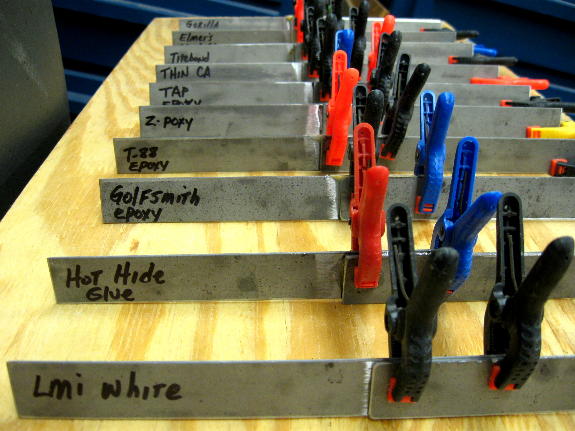
The half lap joint gluing area was abraded on a belt sander in order to improve the glue adhesion to the steel substrate. The same amount of glue (by volume) was applied to the 2” glue zone with a toothed trowel and the other strip was accurately aligned and clamped to it. All spring clamps were the same so there was equal clamping pressure on each test coupon’s joint. Glue squeeze out varied because each glue has its own unique viscosity. The coupons were then clamped up and allowed to dry for 14 days to make sure all the glues were fully cured.
We fabricated a simple mechanical hammer from the same 10 gage steel. A door hinge was welded to the end of the hammer and the other side of the hinge was welded to a magnetic base. We attached the hammer to the anvil pad on a bench vise via the magnetic base. The hammer was cocked to a repeatable distance and held open with a high tech scientifically calibrated Sharpie marker.
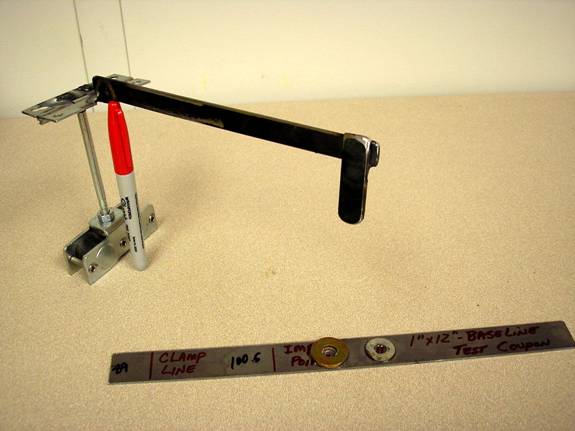
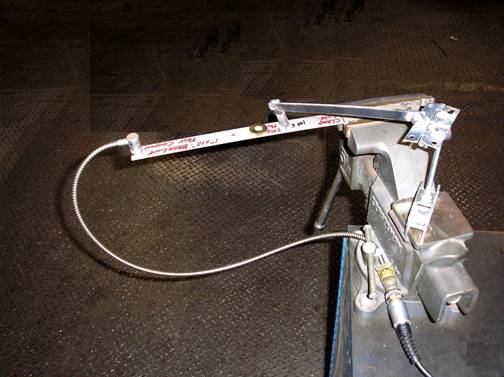
The test coupon was fixed in the vise using the registration mark and the hammer was positioned so it struck the impact registration mark on each coupon. This ensured that the hammer struck the same position on each coupon. All I had to do was remove the Sharpie pen and allow the hammer to fall onto the coupon which induced an impact into the coupon which we could then measure with the vibration analyzer.
The idea for the test was to clamp the test coupon in the vise, strike one side of the glue joint with the impact hammer and then measure the vibration wave after it passed through the joint. We hypothesized that the vibration spectrum or energy wave would be look different for each of the glue we tested. Interpreting the wave spectrum would be the next challenge.
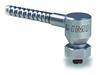
We magnetically mounted a vibration accelerometer on the opposite end of the coupon. This is a device that inputs the vibration or in this case the hammer impact into the vibration data collector. In simplest terms an accelerometer is an extremely sensitive lab quality man made device that converts mechanical energy into an electrical voltage signal. The most common type is piezoelectric sensors
These instruments are used for measuring acceleration, detecting and measuring vibrations, or for measuring acceleration due to gravity (inclination). Accelerometers can be used to measure vibration on vehicles, machines, buildings, process control systems and safety installations. They can also be used to measure seismic activity, inclination, machine vibration, dynamic distance and speed with or without the influence of gravity. In such accelerometers the acceleration is calculated based upon the charges derived from the microscopic crystalline structures when they are accelerated due to motion.
Each sample coupon was firmly clamped in the same vise and the vise handle was moved to the same position with each test coupon to ensure the clamping pressure was consistent. We routed the accelerometer cable in the same way for each test so as not to affect the results.
In order to evaluate the vibration behavior of each of the glues, it would be desirable to measure the natural frequency of a solid piece of base metal without the joint. This would give us a baseline to compare all subsequent tests to. First we performed a “bump test’ on an identical width, length and thickness strip of steel and captured the vibration spectrum on the vibration data collector. The classical way of doing this is to impart a measured and repeatable force into the structure with an instrumented hammer, or other vibration exciter, and measure the response of the structure at the same time the excitation occurs. The vibration force data are analyzed with a dual channel FFT (Fast Fourier Transform) analyzer which calculates the transfer function, or frequency response function between the two channels. It mathematically transforms from the time domain to the frequency domain and vice versa. Since we did not have an instrumented hammer or a method to trigger the data collector to when the vibration impact started we did the best we could with our simple but effective drop hammer.
Usually, in most cases of machine vibration, it is not so important to determine the exact magnitude of the impact or transfer function; the most important information is hidden in the frequencies of the modes of vibration of the structure, and to a lesser extent, the damping associated with these modes. These are the frequencies that we are interested in for this experiment. We want to gain an understanding of how different glues can change the way vibration transfers through them.
A vibration sensor is placed on one end of the test coupon. An impacting device (or our drop hammer in this particular test) is used to hit the test coupon to excite the structural resonance(s) and allow it to vibrate or ring. Think of a gong that has just been hit with a mallet. The gong will produce a vibrating tone (ring) at a frequency equal to its natural resonant frequency. During the test, the resulting spectrum is captured and saved in the vibration data collector or spectrum analyzer. Inherent natural frequencies or resonances are seen as high level humps or peaks in the vibration spectrum, usually with a broad base at the bottom.
You have probably read where some builders “tune’ their tops and backs to be a few semi tones apart. The reason they are doing this because if the top and back vibrate at the same frequency they will tend to cancel each other out and the result will be a less desirable and less powerful musical instrument. In any musical instrument, the vibration excitation forces from its strings should be well away from the natural frequencies of the sound box. This is done to avoid resonant responses that can cause volume level changes when certain notes are played that would excite the resonant frequency of the sound box.
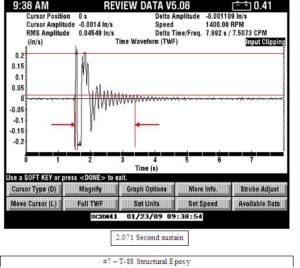
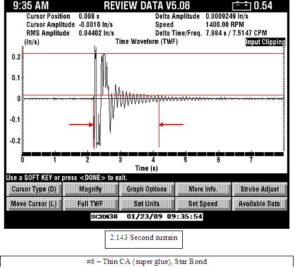
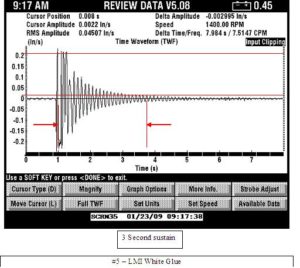
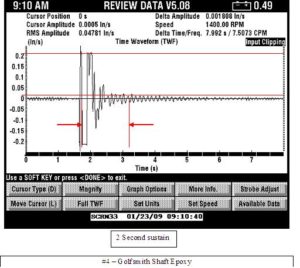
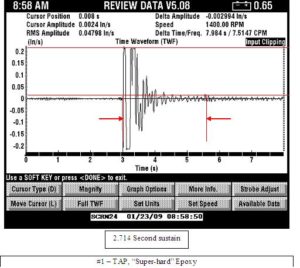
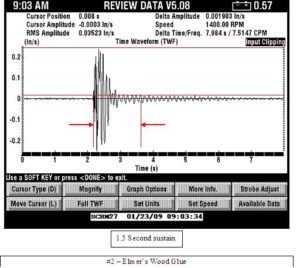
Initially, looking at the time waveform graphical representation, it appears to be a bunch of squiggles on the screen. However, a trained eye can learn much information from the data. To understand what you are looking at, the left side vertical scale represents the amplitude which is the magnitude or in simpler terms the volume level as it might relate to a guitar player. The horizontal base line of the graph measures time (in seconds) when the impact or sound occurred and how long the sound lasted or sustained.
You will see some ripples before the first peak on each graph. This is just ambient noise that the sensor or accelerometer is picking up and should be ignored. After the hammer falls and strikes the coupon t he signal or waveform begins, which starts at basically at zero amplitude, lasts for a certain time, and ends at zero amplitude. As the signal decays, do to the glues dampening affect the amplitude drops over time. This is easy to see in the graphs and one can quickly tell that each glue has its own unique dampening characteristic.
Since I don’t have the $40,000.00 software on my computer, Wyatt emailed a screen shot of the time wave form in MS Word format so I could work with it on my computer. I added a pair of horizontal arrows pointing to two vertical lines. The area between the arrows is the distance, in time that I measured to extrapolate the length of the decay or sustain. Invisible grid snaps are enabled in MS Word so I was limited on where I could move the lines to on each graph so if you see the lines don’t line up accurately with the peaks don’t be alarmed. Therefore, I measured the exact distance, with a digital caliper, where the first peak started from 0 and to where the last peak touched the horizontal line above the “0” Amplitude scale. Then I converted the exact length measurement to seconds of time and recorded that number in the box below the graph to represent the length of sustain.
The highest initial peak graphically represents the amplitude of the hammer striking the test coupon, relative to and measured from zero. The wave form begins at zero, rises to its peak amplitude after being struck by the hammer then quickly falls back to zero. It rises again as the coupon’s resonant frequency begins to vibrate and peaks at the about the same amplitude of the hammer strike then falls back to zero. The vibration wave continues to rise and fall as it decays based on the vibration energy being dampened as it passes back and forth through the glue.
The second peak, to the right of the first initial highest peak, represents the natural resonant frequency of the particular test coupon. I added the upper horizontal line to show how similar the first and second peak amplitudes are on each graph. This is important to note because it tells us that the impact amplitude is repeatable on each graph and that the resonant frequency is very similar on each coupon. This also tells us that the variation between each test and between each test coupon material is very minimal making the test results more credible.
The rest of the peaks on the graph represent the harmonics or side bands of the resonant frequency induced by the hammer as the coupon continues to vibrate. If you measured the distance between each peak it would be equal to or a multiple of the main frequency measured in seconds of time. You will also notice that the amplitude & decay are different in each graph which indicates that there is a distinct and measureable difference of the way the vibrations travel through each glue joint. This was quite exciting for us to be able to clearly identify a measureable difference in each of the glue joints we tested.
Each of the glues had its own unique vibration signature or its own characteristic pattern of vibration after it was set in motion. We tested each coupon multiple times and each vibration signature was nearly identical measured out to 6 decimal places. This proved that each coupon responded to the impact hammer and vibrated the same way each and every time it was struck with the hammer. Each of the vibration signatures proved that our test method was consistent and repeatable.
The 10 glues that we tested are as follows:
|
Test Coupon # |
Adhesive |
|
1 |
TAP “Super Hard” Epoxy |
|
2 |
Elmer’s Wood Glue |
|
3 |
Titebond Original |
|
4 |
Golfsmith Shaft Epoxy |
|
5 |
LMI White |
|
6 |
Thin CA “Super Glue” |
|
7 |
T-88 Structural Epoxy |
|
8 |
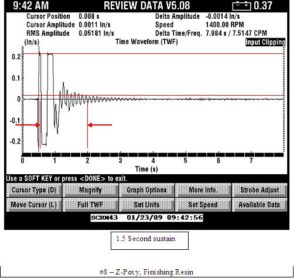
Z-poxy “Finishing Resin” |
|
9 |
Gorilla Glue |
|
10 |
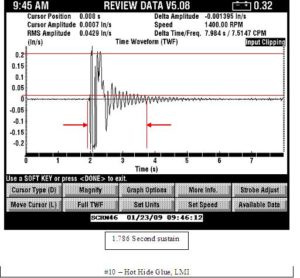
Hot Hide Glue |
|
11 |
Test Coupon (base line) |
|
12 |
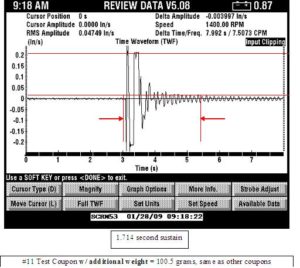
Test Coupon (w/ weight) |
Below are the time waveforms for each of the glues tested:

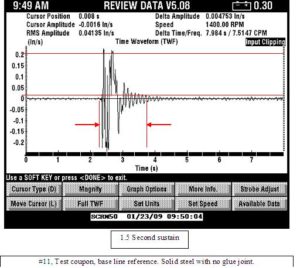

After we had run all of the tests the base line test spectrum looked different than the other tests. I had a hypothesized that the time waveform should have looked better without a joint but in fact it did not. The results baffled me. I concluded that it must be due to the fact that even though the same base line coupon was identical in size, the mass was less because it lacked the center overlapping joint. Therefore I attached flat washers to the mid section to bring the mass up to the same weight as the average weight of the other test coupons with glue joints. We tested it again and the results were better.
I went into this test with a hunch that HHG and LMI White glue should prove to be the best performing glues based on personal use and some previous hardness tests that I had done. Those two glues were the hardest of all the glues I had tested so therefore they “should” transfer vibration energy the most efficiently. HHG had a decay time of 1.7 seconds which is the same length of time that the baseline test coupon (with the appropriate weight) sustained.
Vibration Data Collector
Entek DataPak 1500 – Odyssey Software
Accelerometer – IMI – 607M13, 94 mv/g
PdM Technician – Wyatt B.
Test date – 1/23/2009
|
Test Coupon # |
Adhesive |
Weight |
Decay/sec |
|
5 |
LMI White |
3.015 |
|
|
1 |
Tap “Super hard” Epoxy |
2.714 |
|
|
6 |
Thin CA (Star Bond) |
2.143 |
|
|
7 |
T-88 Structural Epoxy |
2.071 |
|
|
4 |
Golfsmith Shaft Epoxy |
2.01 |
|
|
10 |
Hot Hide Glue |
1.786 |
|
|
12 |
Test Coupon (w/ weight) |
1.714 |
|
|
9 |
Gorilla Glue |
1.571 |
|
|
2 |
Elmer’s Wood Glue |
1.5 |
|
|
8 |
Z-poxy “Finishing Resin” |
1.5 |
|
|
11 |
Test Coupon (base line) |
1.5 |
|
|
3 |
Titebond Original |
1.42 |
The puzzling part of the results, that I can not yet explain are why five glues actually improved the amount of sustain over and above the baseline test coupon sustain time. The fact is that LMI “White” glue has the longest sustain which is nearly twice that of the baseline coupon. It clearly has the best looking decay bell curve and holds its amplitude higher and longer than any other glue in this test.
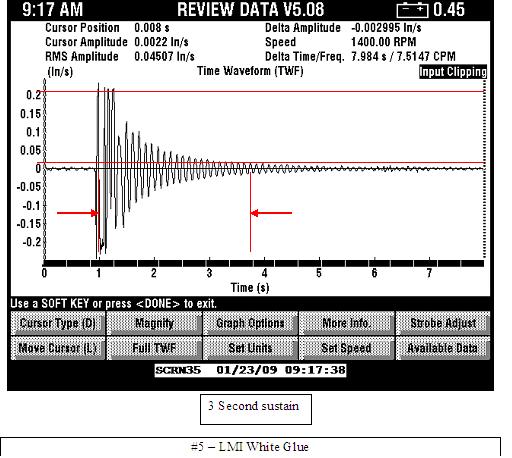
I knew from experience that it is an excellent glue to use in lutherie. Based on these tests alone it is a no brainer [at least for me] to use it in place of HHG because of its shear ease of use and hardness test results. The graphical display of a near perfect bell curve is just icing on the cake.
This test should not be the end of your research but rather a starting point for others to pick up from. It has taken a great deal of time and work to get to this point but I will continue to forge ahead to build the next instrument better than the last one. The results in these tests are factual to the best of my knowledge which is why I enlisted the help of an expert in this field. May this article be a challenge to all builders to have a burning desire to learn more, explore new products with an open mind and share your knowledge with others while continuing to be humble and passionate about promoting our craft in the precious time that we have remaining.
